Graphing is an essential skill that lays the groundwork for data interpretation and critical thinking. Teaching graphing in kindergarten begins with mastering foundational math skills and progresses to more complex representations like bar graphs. Let’s explore how to guide young learners through this journey in an engaging and developmentally appropriate way.
Start with the Basics: Counting and One-to-One Correspondence
Before introducing graphing, students must have a strong understanding of counting and one-to-one correspondence. These skills are the backbone of any graphing activity. Here are some ideas to strengthen these foundational skills:
- Counting Objects: Use everyday classroom items like blocks, crayons, or counters to practice counting. Ask students to count aloud as they touch each item to reinforce one-to-one correspondence.
- Matching Activities: Provide activities where students match numbers to sets of objects, ensuring they understand the concept of quantity.
- Counting Games: Incorporate games like “Roll and Count,” where students roll a die and count out the corresponding number of items.
Progress to Sorting and Categorizing
Sorting and categorizing are the next steps toward graphing. These activities help students understand how to group items based on attributes, a key skill for creating graphs.
- Sorting by Color, Shape, or Size: Provide manipulatives like buttons, bears, or pom-poms for students to sort. Encourage discussions about why items belong in specific groups.
- Sorting Challenges: Pose questions like, “How many red blocks are there?” or “Which group has the most items?” to begin introducing the idea of comparison.
- Interactive Charts: Use pocket charts or large floor mats for hands-on sorting activities that allow students to visually see the groups they’ve created.
Introduce Tally Marks
Tally marks are a simple and visual way to start organizing data. They also build on students’ counting skills while introducing them to a systematic method of recording information.
- Count and Tally: Give students opportunities to count classroom items, such as pencils or books, and record their findings using tally marks.
- Tally Surveys: Conduct simple questions like, “What is your favorite color?” or “Which fruit do you like best?” Have students tally responses on a chart.
- Group Tally Activities: Work together as a class to tally items, reinforcing the concept of grouping marks in sets of five for easy counting. This works well when counting the days of the school year during calendar time.
Transition to Picture Graphs
Picture graphs are an excellent way to introduce students to graphing visually and engagingly. Using images allows students to see how data is represented in a graph.
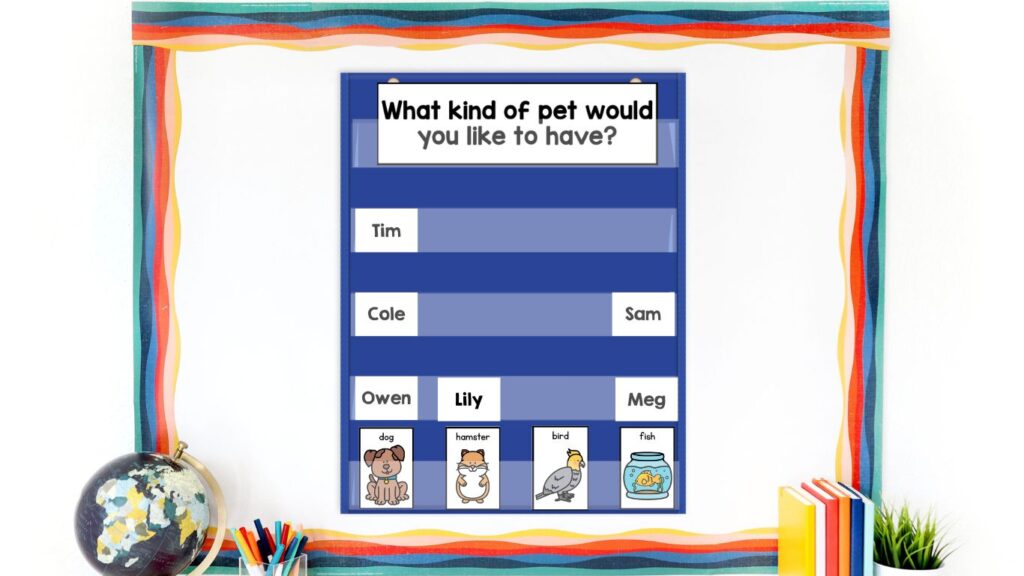
- Create Picture Graphs Together: Use pre-made templates or draw a simple chart on the board. For example, collect data on students’ favorite pets and represent each choice with a picture.
- Interactive Graphs: Have students place stickers or draw symbols in the appropriate columns to represent their responses.
- Ask Questions: Develop analytical skills by asking questions like, “Which column has the most pictures?” or “How many students like cats?”
Move to Bar Graphs
As students approach the end of kindergarten, they’re ready to transition to bar graphs. These graphs offer a more traditional way of representing data and preparing students for first-grade math.
- Hands-On Bar Graphs: Use large graphing mats or posters where students can place blocks or draw bars to represent data. Start with simple topics like “How many students are wearing red today?”
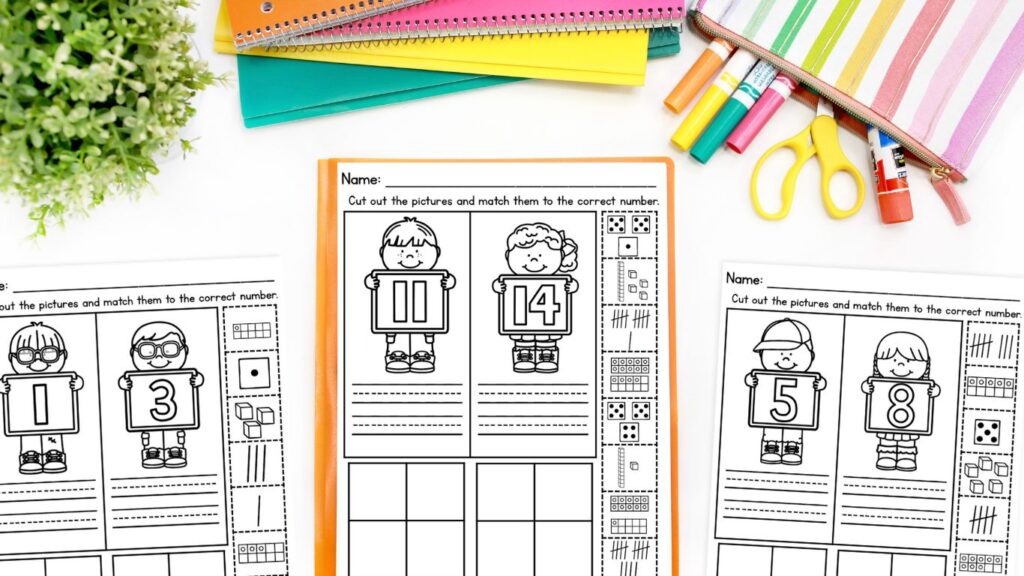
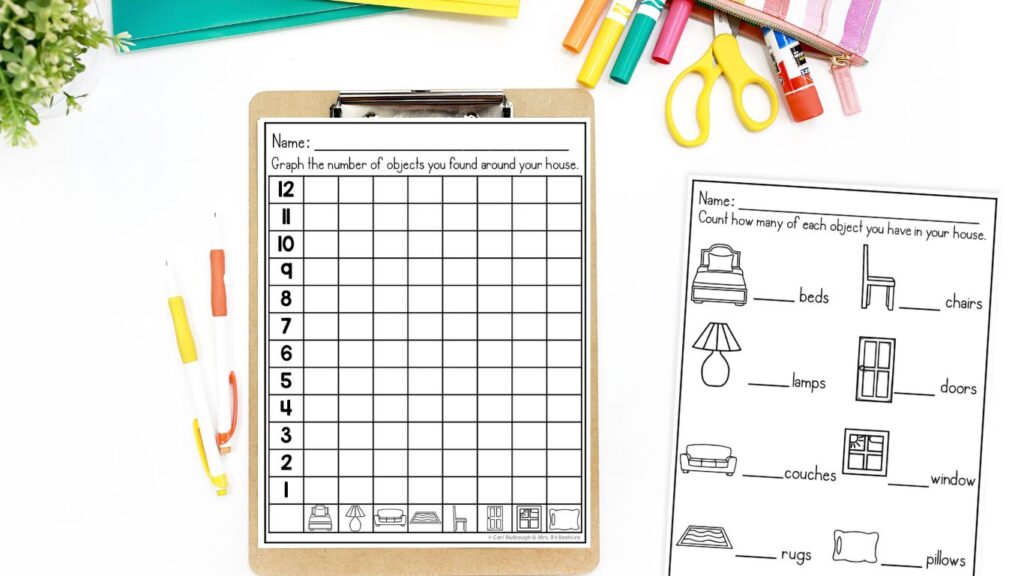
- Independent Practice: Provide worksheets or printable activities where students can create their bar graphs based on the provided data. Check out the free resource below you can send home with your students for extra graphing practice.
- Data Interpretation: Begin teaching students how to read and interpret bar graphs by asking questions that require comparison and analysis.
If you would like a free copy of this resource, just fill out the information below:
Fun and Engaging Graphing Activities
To keep students excited about graphing, incorporate activities that are meaningful and interactive:
- Graphing the Weather: Track daily weather conditions and create a class bar graph at the end of the week.
- Favorite Snacks: Collect data and create student preference graphs during snack time.
- Seasonal Graphing: Tie graphing activities to holidays or seasons, such as graphing the number of pumpkins, apples, or snowflakes in the classroom.
- Interactive Practice: During math centers, let students practice graphing activities that also help build fine motor skills by dragging and dropping items into the correct categories.

Building a Strong Foundation for Graphing in Kindergarten
By starting with counting and one-to-one correspondence, progressing to sorting and tally marks, and ending with bar graphs, kindergarten students develop a strong foundation in graphing. These skills not only prepare them for first grade but also help them make sense of the world around them. With engaging activities and hands-on experiences, graphing can become a favorite part of your kindergarten math curriculum.